
WorkTime™ Analytics
The proof, ready when you are.
Every hour WorkTime™ Automation records rolls into reports you can pull on demand — by program, level, site or resident. Weekly summaries arrive on their own, and Wellness Scores™ track workload over time. Built for audits, ACGME site visits, and the questions you already know are coming. Request a demoSee what you get
Built for Program Directors, Coordinators, GME administrators and DIOs. Export-ready for audits and ACGME site visits.
What you get
Four things, all from hours already being recorded.
No submissions to collect, no data entry to police. Every report runs on what WorkTime™ Automation already records.
Report on demand
Run any of the six reports yourself, filtered to the programs, levels, sites or residents you need.Delivered weekly
A weekly summary lands in the right inboxes on its own — no one has to remember to run it.Wellness over time
See workload patterns building over weeks, not just whether a single rule was broken.Ready for scrutiny
Custom date ranges and exports built for reviews, audits and ACGME site visits.Reports
Six reports, ready when you are.
The Reports tab runs on the same recorded hours as the dashboards. Choose your programs and a date range, then run.- Run any of the six on demand — by program, PGY level, WorkZone™ or individual resident.
- Set any date range: a single rotation, a quarter, or a full academic year.
- Built for reviews, audits and ACGME site visits.
- Export the WorkTime Summary to Excel, or pull the raw logs as a CSV.
- No Recorded Hours leaves out residents in AwayMode™, inactive accounts and accounts that have never recorded — and counts them in the footer, so the list is people to follow up with.
Wellness Score™
Workload, not just compliance.
Staying inside the rules and having a sustainable rotation are not the same thing. Wellness Score™ shows the pattern underneath the compliance answer.- Workload trends across a program over time
- Comparison between programs at institution level
- Context for conversations about rotation design
- A signal that arrives before burnout does
What’s in the Reports tab
WorkTime Summary
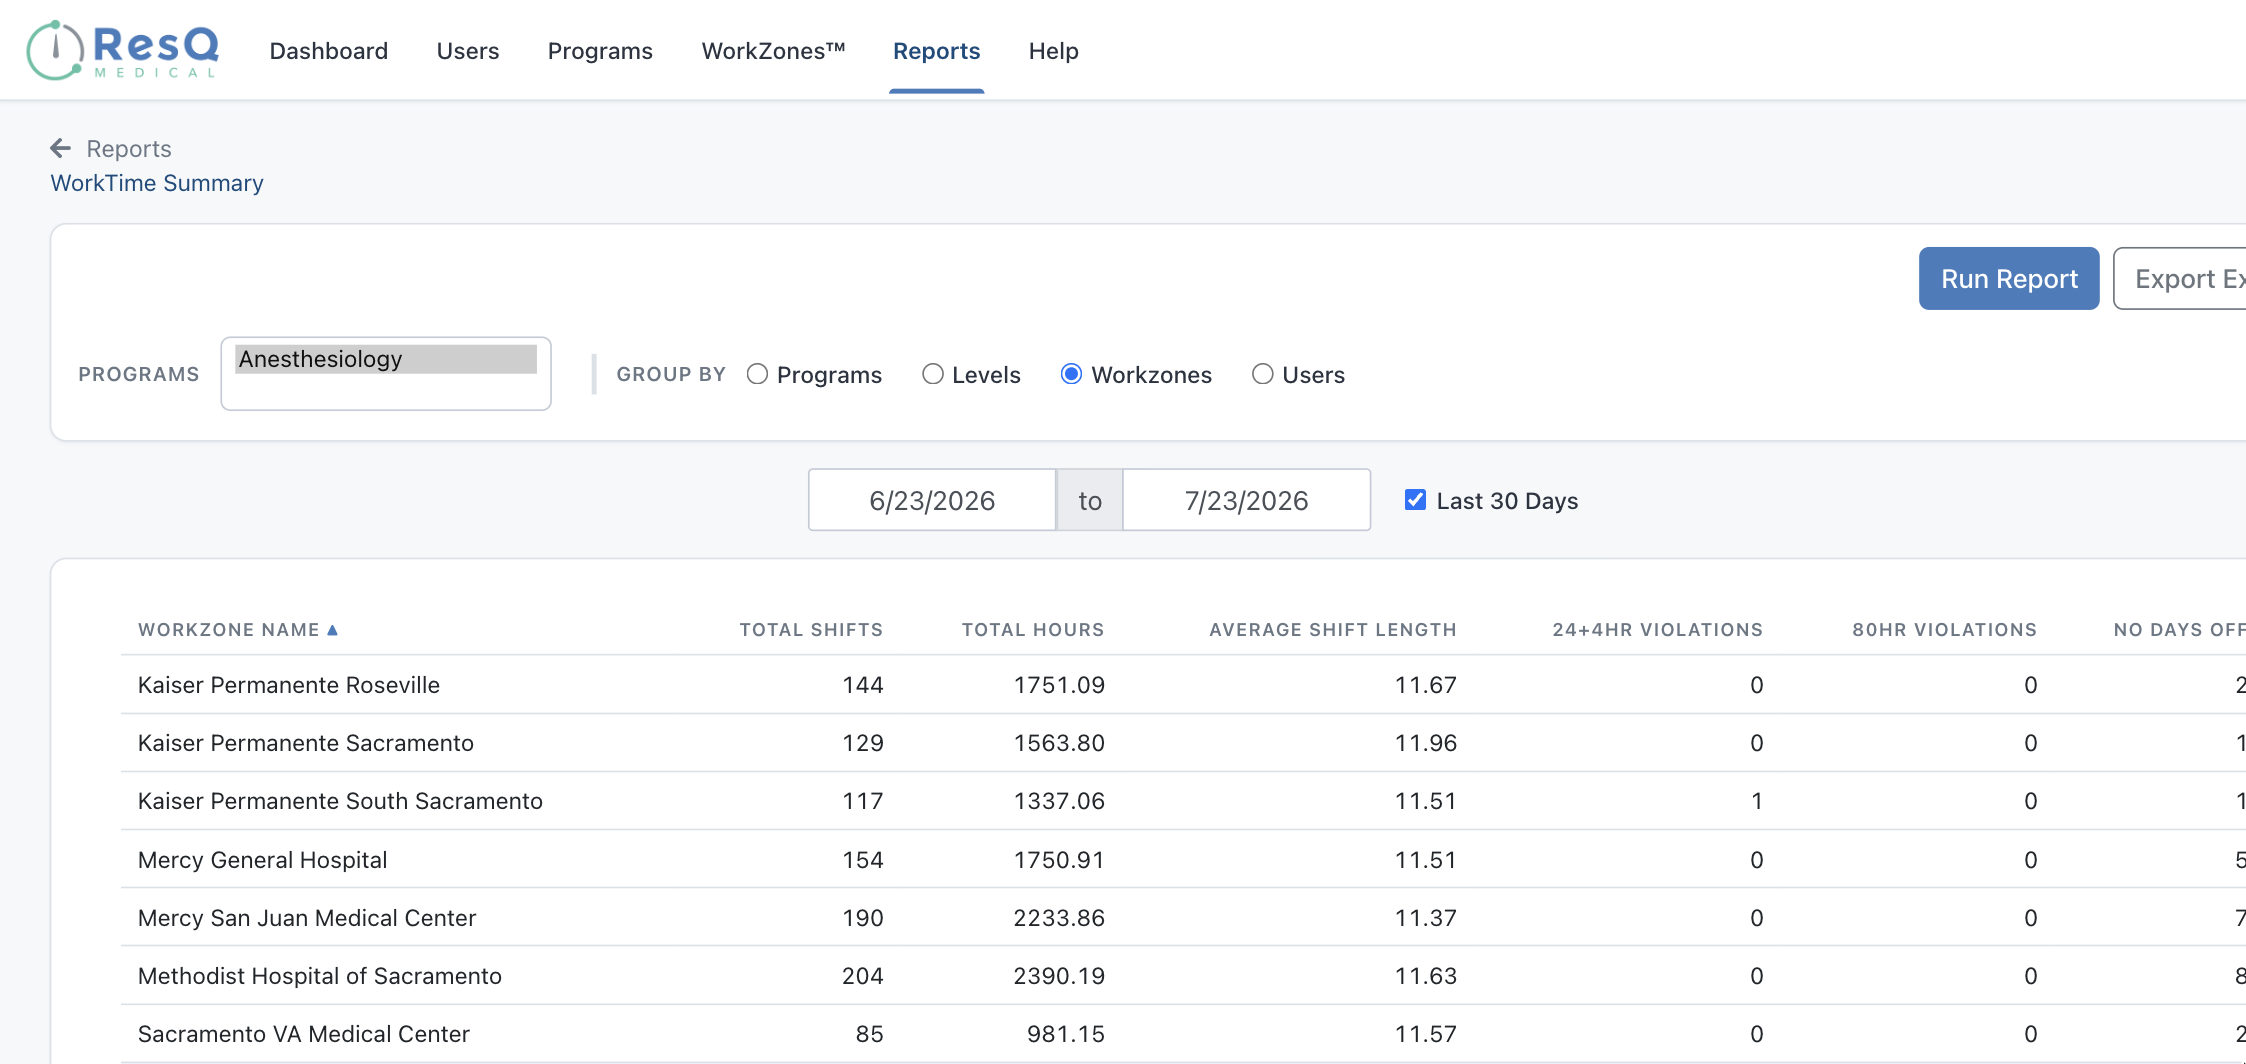
Total shifts, total hours, average shift length and work-hour violations — grouped by program, PGY level, WorkZone™ or individual resident. Group by WorkZone™ and every site appears side by side. Exports to Excel.WorkZone Daily Detail
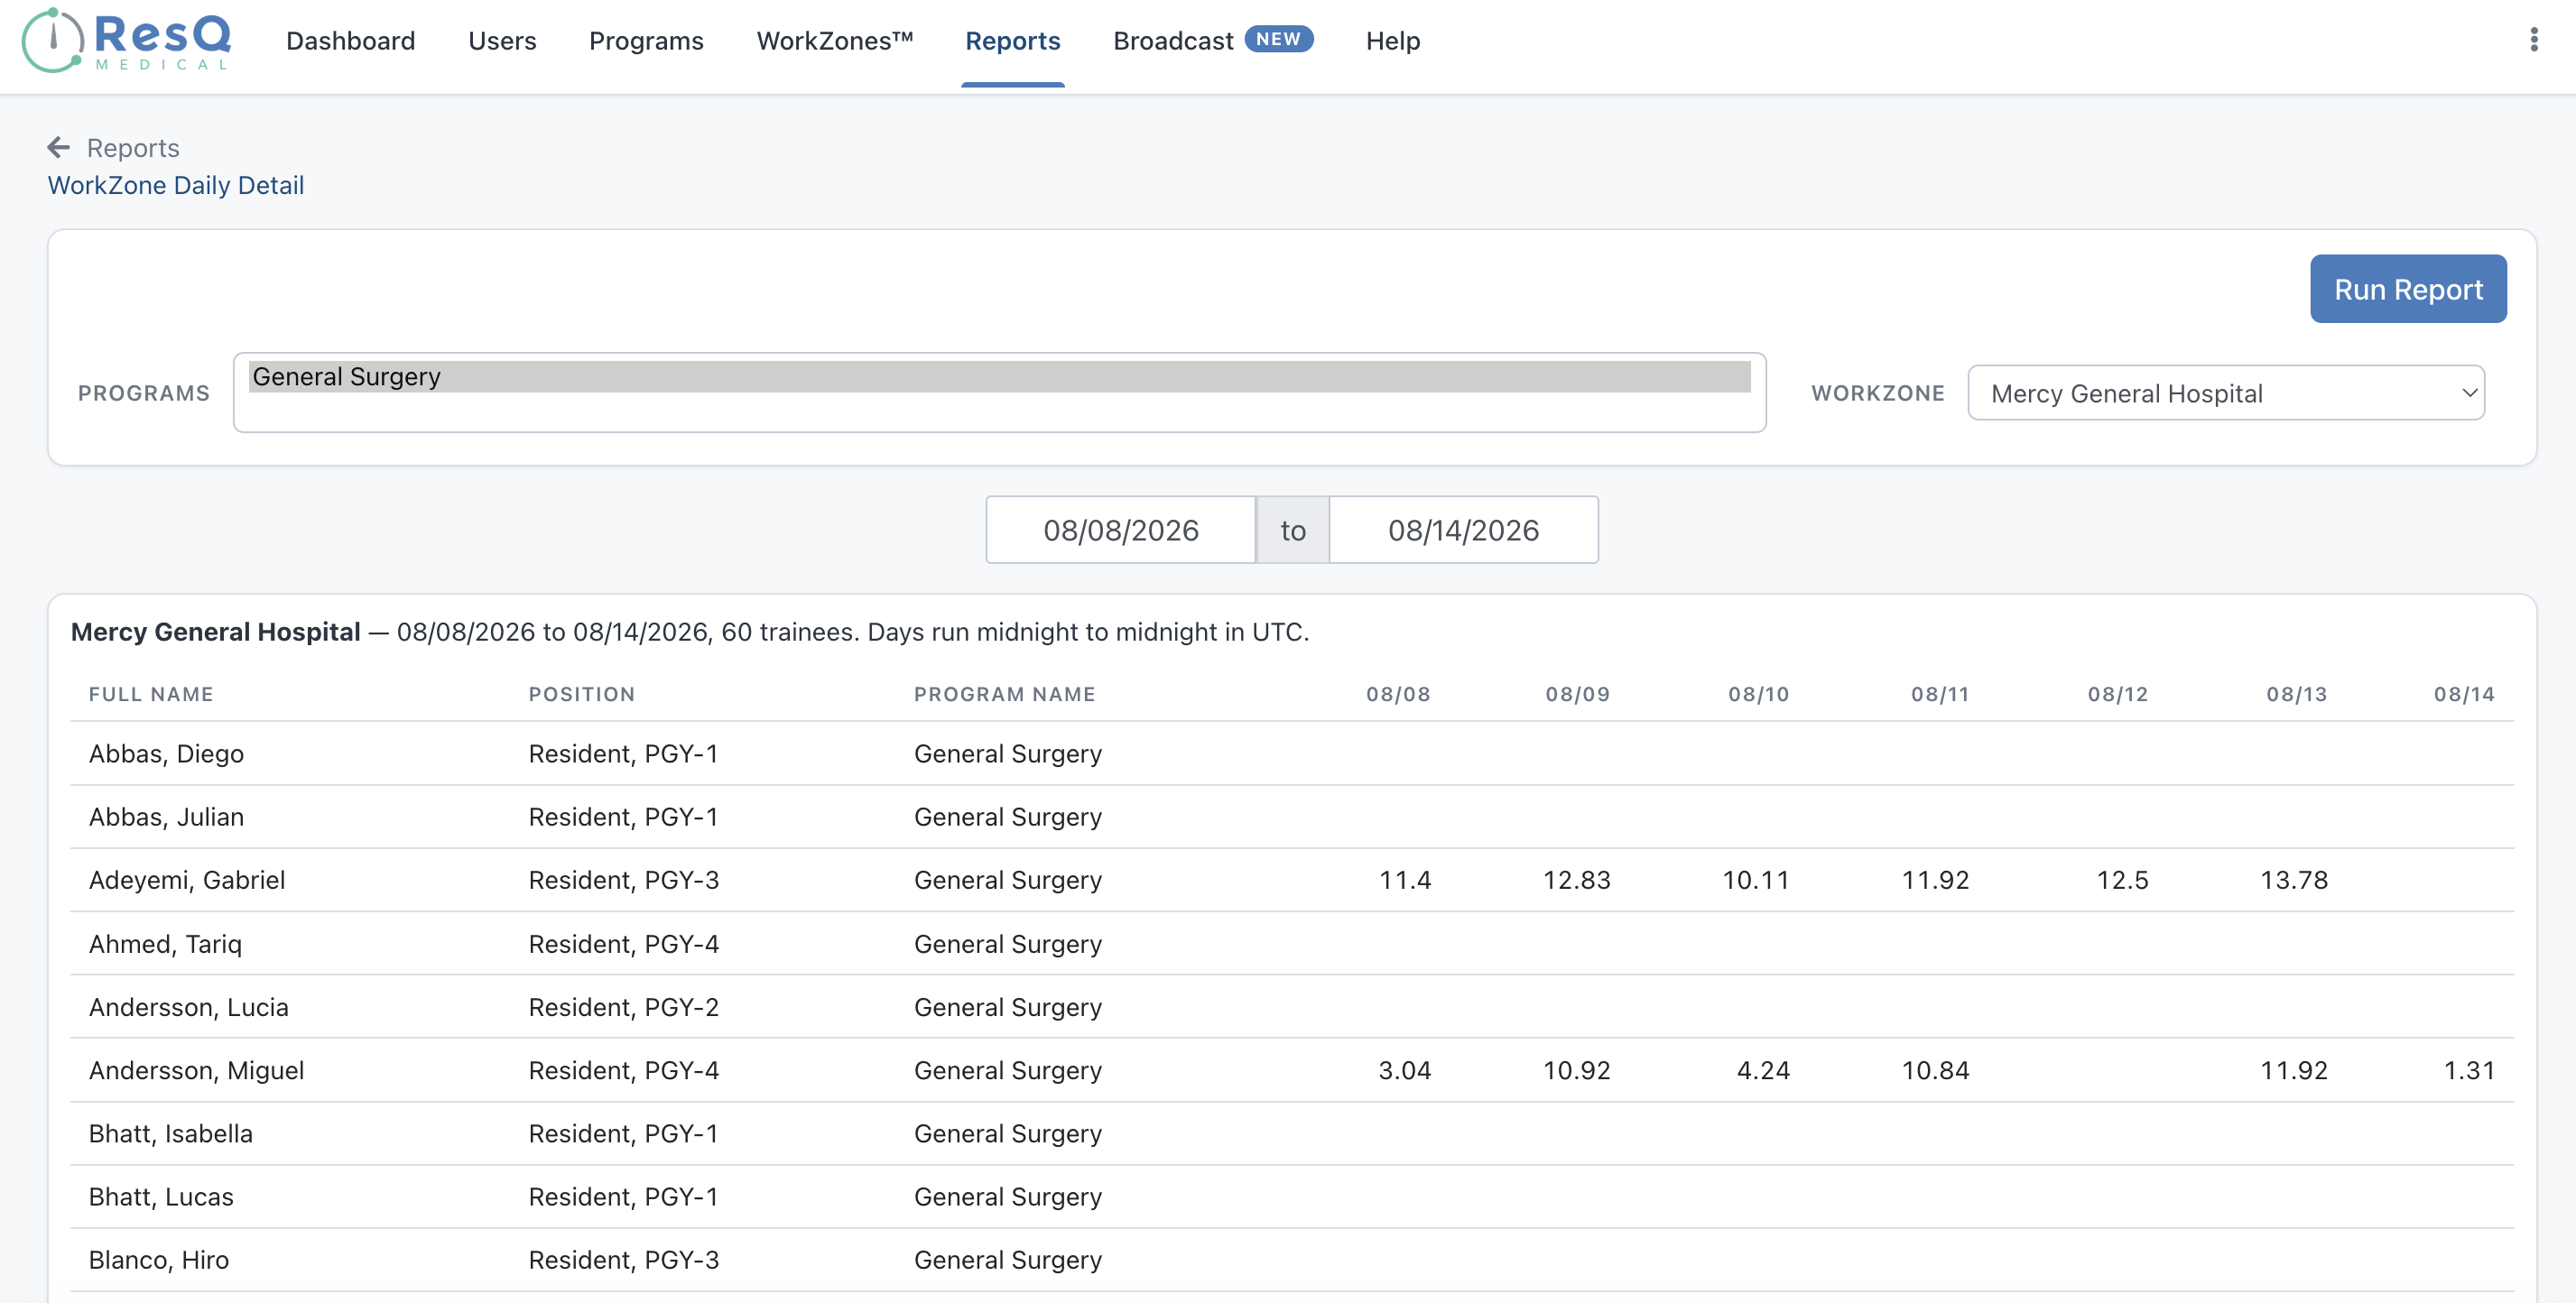
Hours per resident, per day, at a single WorkZone™, with one column for every date in the range. The closest thing to a day-by-day record of who was on site and for how long.Trainee Wellness Summary
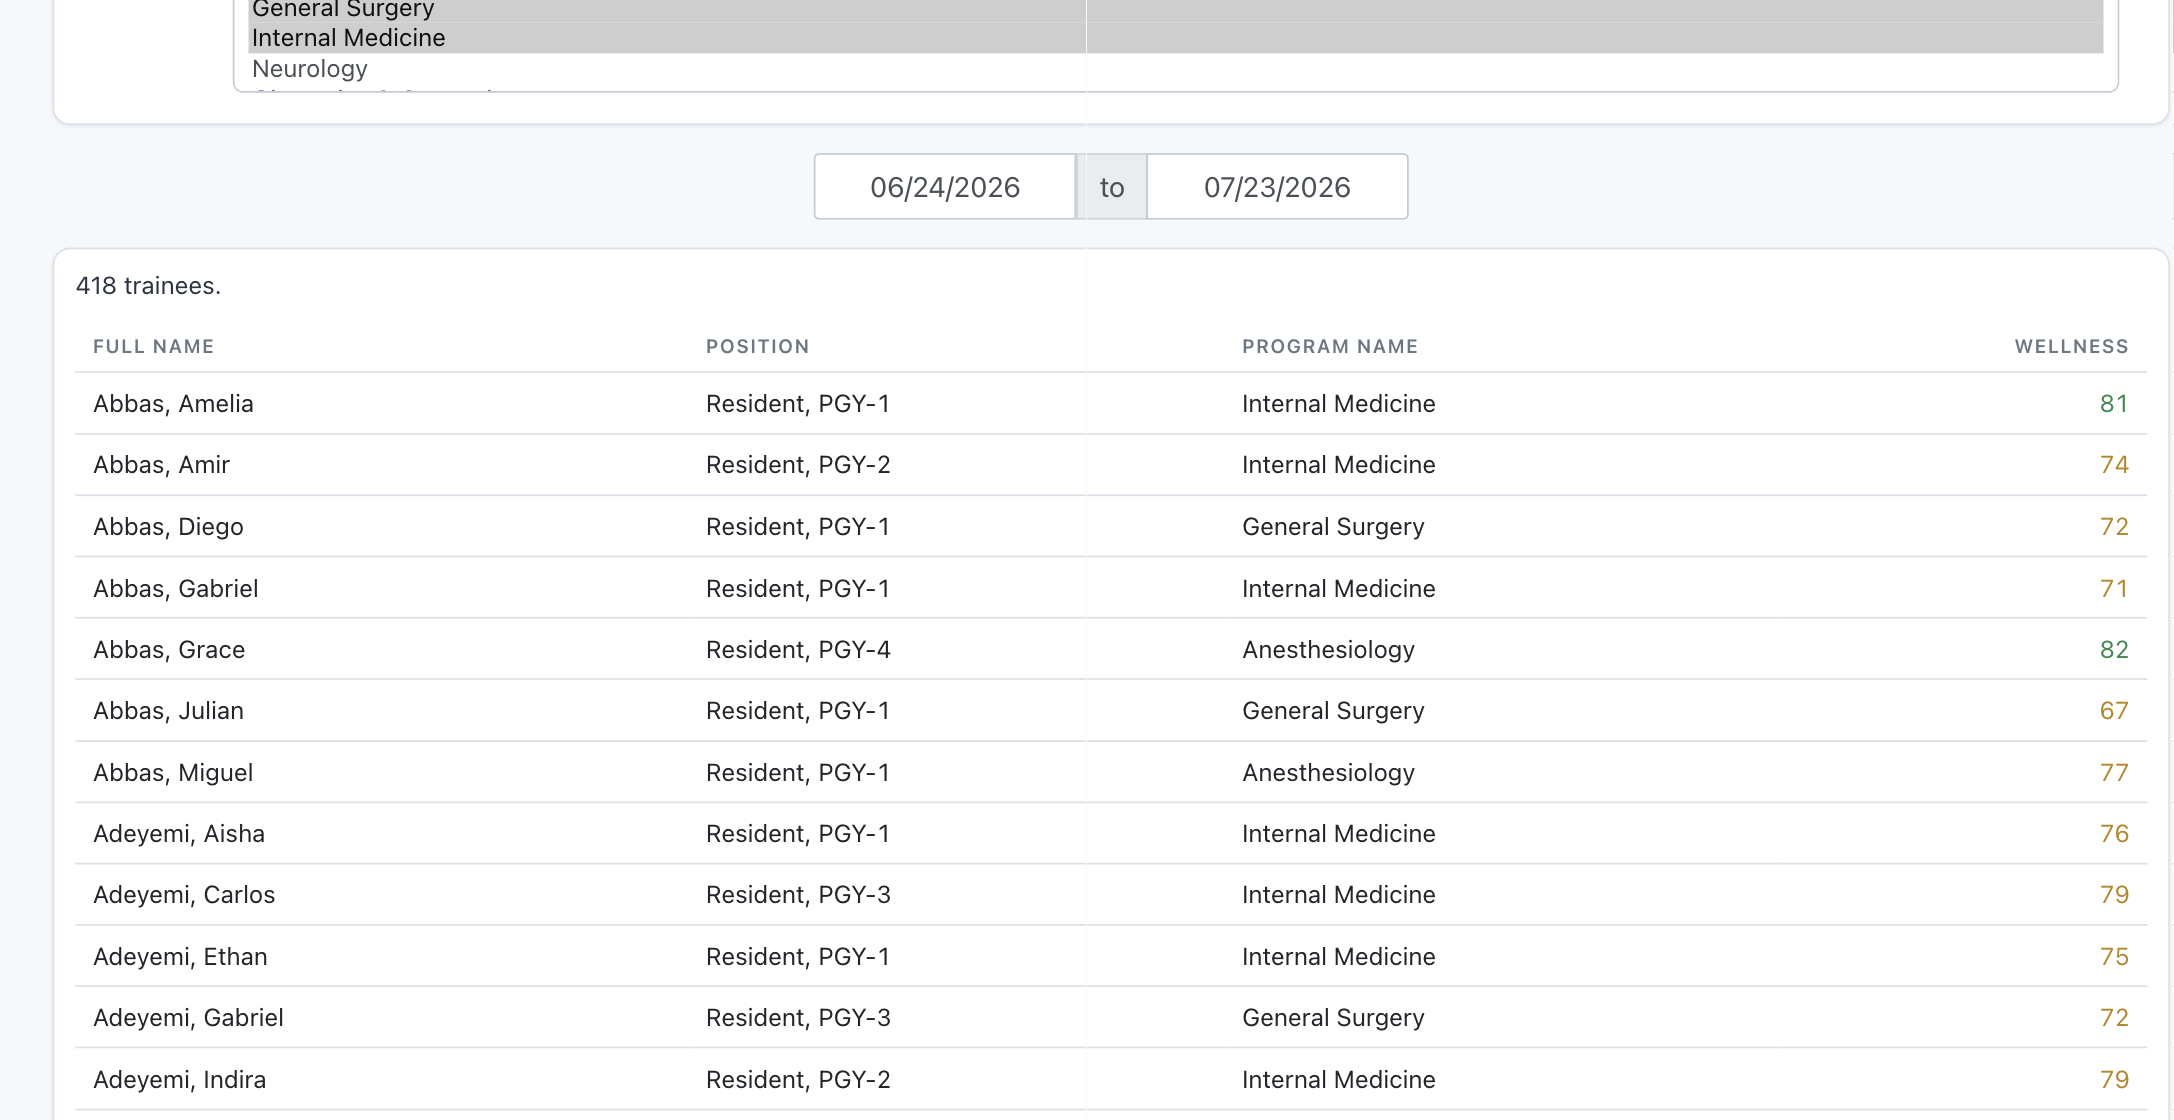
A Wellness Score™ for every resident in the selected programs across the date range, color-coded so the scores worth a conversation stand out immediately.Need every affiliate site reconciled at once, with cost attached? That is what AffiliateView™ (coming soon) is for.
Dashboard
Short breaks, counted before anyone asks.
A Short Break Violations tile now sits on the Dashboard alongside 24+4, 80 Hour and No Days Off, covering the last 30 days. It measures the rest gap between one recorded work period and the next, so a thin turnaround surfaces while the block is still running rather than in a report afterwards.
Institutions following New York State rules see the same tile as Rest Violations.
Like every figure on the Dashboard, it reflects the hours that were recorded — a flag worth looking into, not a compliance verdict.

Host site, day by day
See where the hours actually happened.
The WorkZone™ Daily Detail report gives you a day-level record of the hours worked at each host site — a manual but real way to verify affiliation hours and invoices against where residents actually were.
When residents rotate across affiliated and host institutions, you get a clear, location-by-location account of who was where, and for how long.
Delivered, not fetched
The weekly summary arrives on its own.
Residents receive their weekly hours, their four-week average and a compliance checklist. Administrators receive the equivalent for their programs. Nobody has to log in to find out where things stand.
Who it is for
Scoped to the role, from one set of recorded hours.
Program-level users see their own programs. The GME office sees everything.
Program Directors
See risk building in your own residents in time to change a schedule, and walk into review with figures you did not have to assemble.Program Coordinators
Stop chasing submissions and stop rebuilding reports by hand. The data is already there, filtered how you need it.GME administrators and DIOs
Institution-wide visibility across every program, with the ability to drop into any single one without changing tools.Common questions
Before you ask
Does this require residents to submit anything?
No. Every figure comes from hours WorkTime™ Automation already recorded. There is nothing to collect and nothing to chase.Can Program Directors see other programs?
No. Program-level access is limited to the programs a user manages. GME administrators and DIOs see across every program at the institution.Is this enough for an ACGME site visit?
Reports can be generated by program, PGY, WorkZone™ or resident over any date range and exported. Whether that satisfies a specific review is a judgement for your institution — we will happily walk through it with your GME office.Does it replace our residency management system?
No. Recorded hours sync to MedHub, Medtrics and New Innovations, so this sits alongside the system you already use.What does Wellness Score™ actually measure?
It looks at workload patterns over time rather than a single compliance threshold. There is more detail on the Wellness Score page.The rest of the ResQ family
Where this sits.
See the reporting on your own programs.
A 30-minute walkthrough with the ResQ team, using your own programs as the example.