
WorkTime™ Analytics: walk into any review with the numbers ready
“Can you pull the hours by PGY level for last quarter?”
In a lot of programs that question costs somebody an afternoon — exporting, stitching spreadsheets together, chasing the two residents whose logs are thin, and hoping the total holds up if anyone asks how it was built.
WorkTime™ Analytics is the answer to that question taking minutes instead. Choose your programs, set a date range, run the report.
Four reports, ready when you are
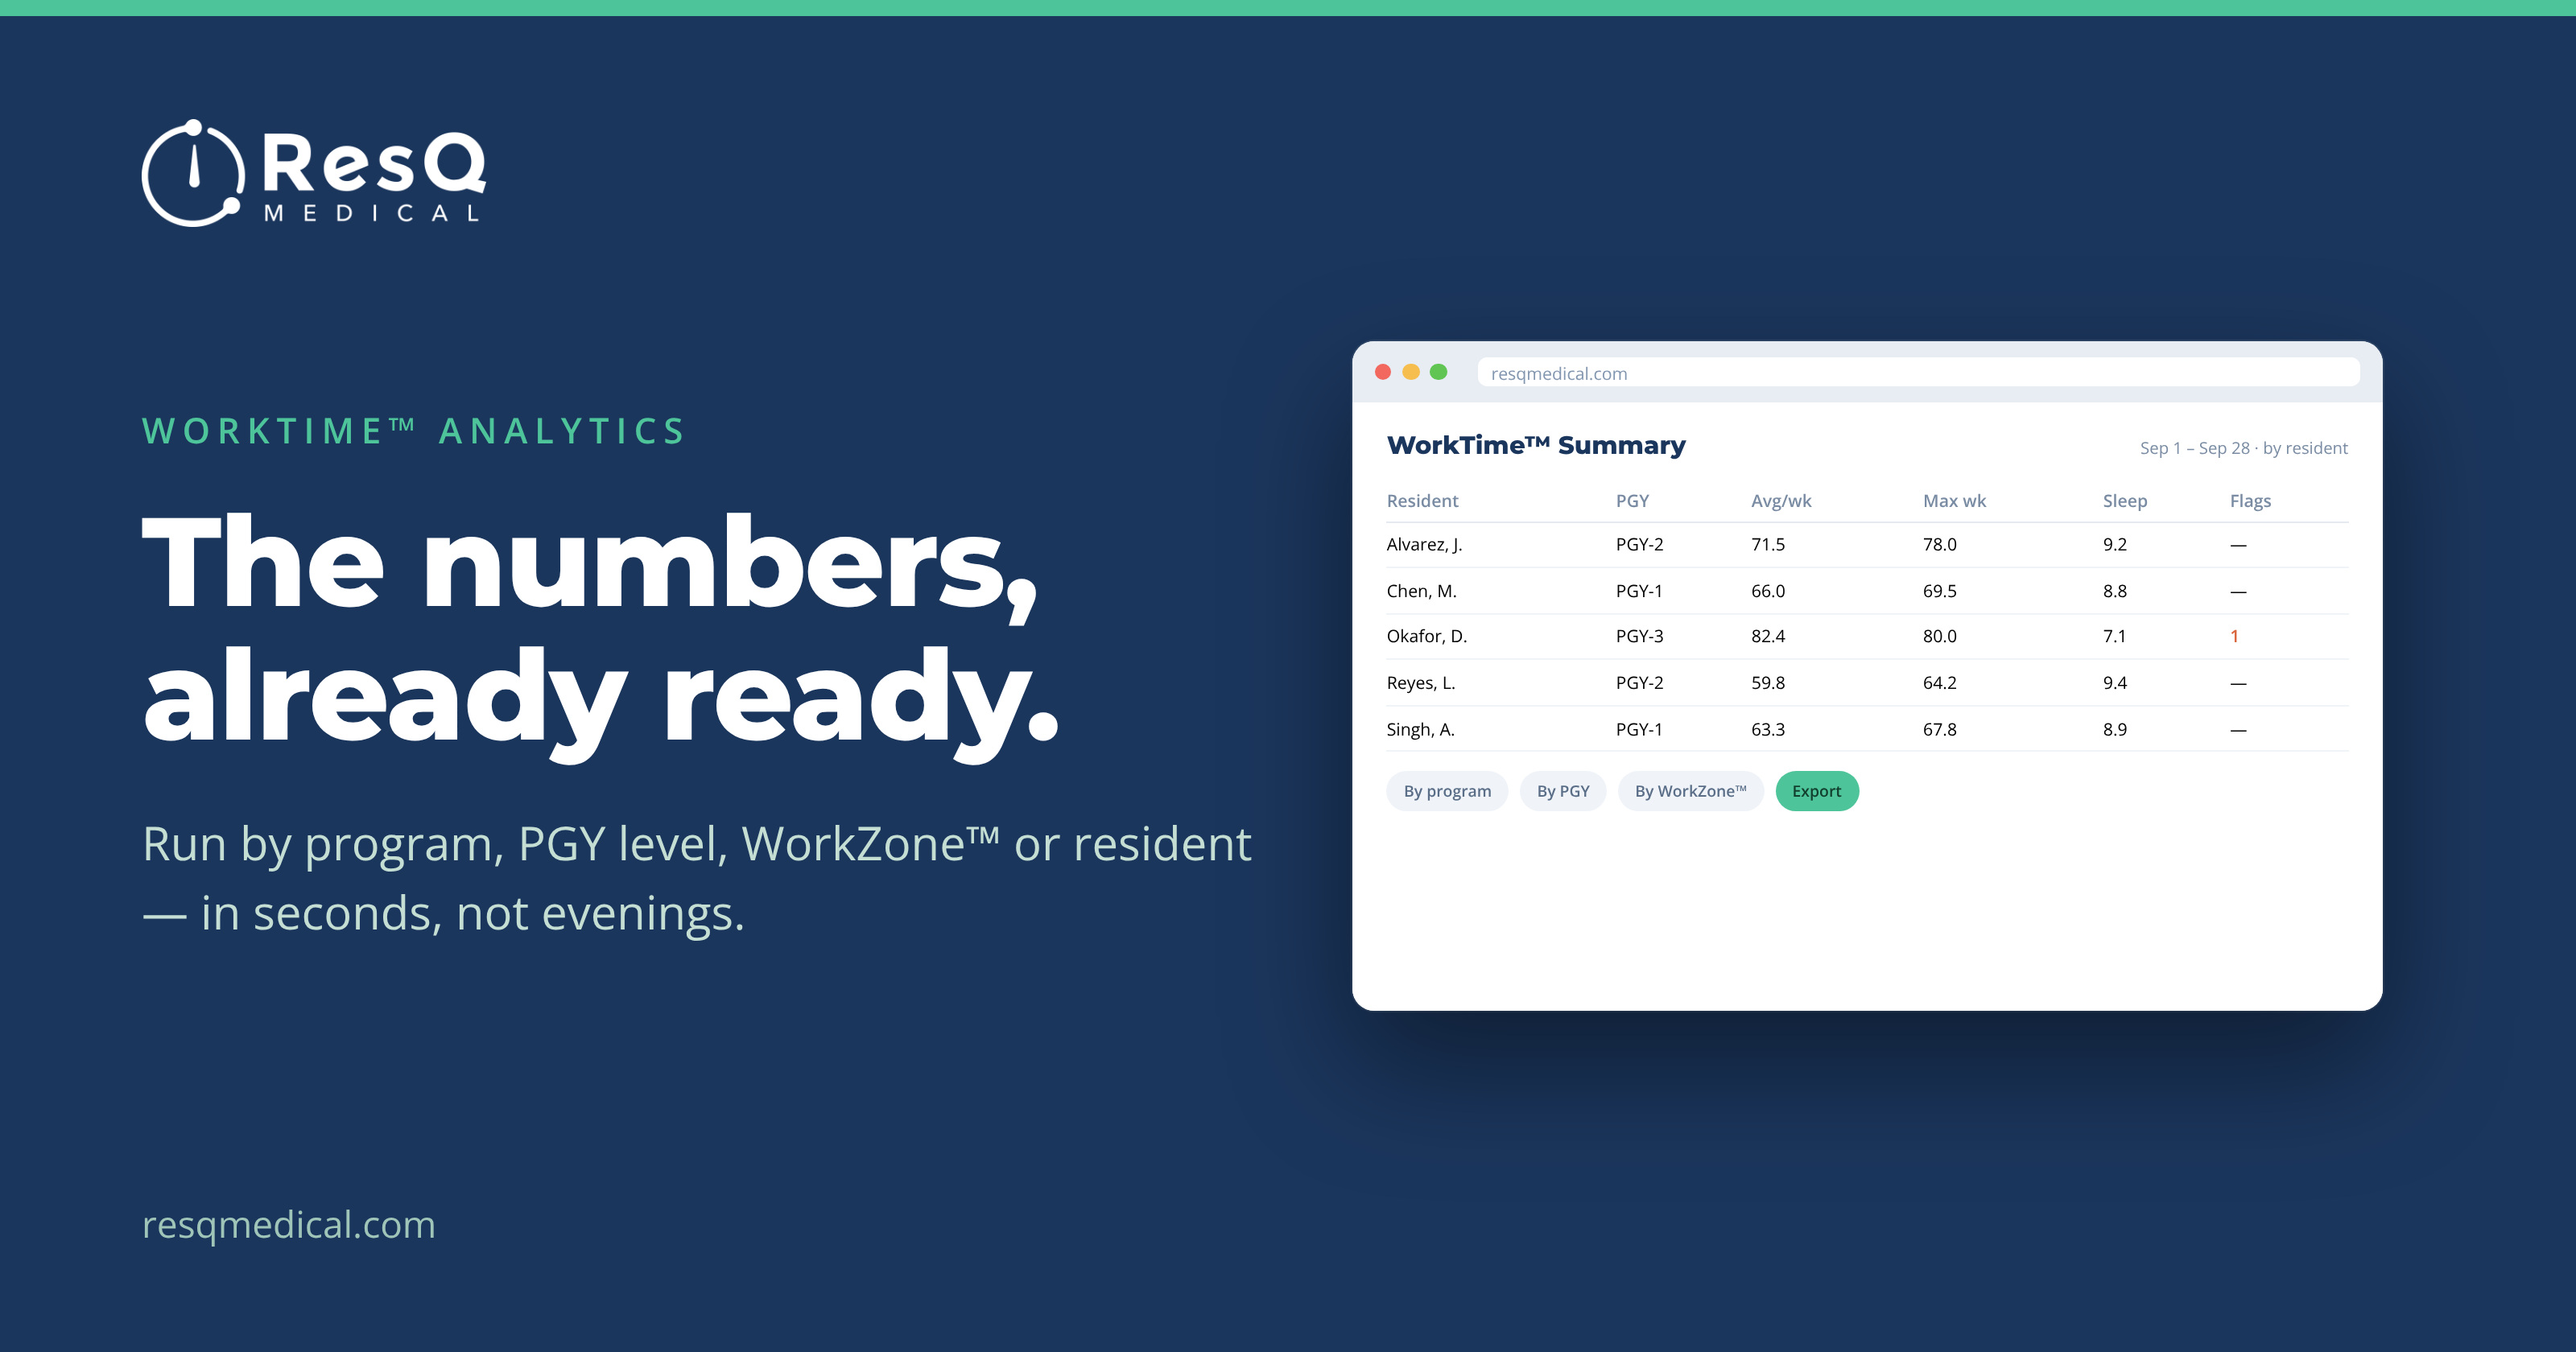
- WorkTime™ Summary — total shifts, total hours, average shift length and work-hour violations, grouped by program, PGY level, WorkZone™ or individual resident. Group by WorkZone™ and every site sits side by side. Exports to Excel.
- WorkZone™ Daily Detail — hours per resident, per day, at a single WorkZone™, with one column for every date in the range. The closest thing to a day-by-day record of who was on site and for how long.
- Trainee Wellness Summary — a Wellness Score™ for every resident in the selected programs, color-coded so the ones worth a conversation stand out immediately.
- WorkTime™ Data Export — every raw work-time log for the selected programs, as a CSV.
Any date range works: a single rotation, a quarter, a full academic year.
Why the numbers hold up
The reports are only as good as what’s underneath them, and what’s underneath is hours recorded automatically as residents moved through their WorkZones™ — not entries reconstructed days later. The report reflects where residents actually were, day by day.
Practically, that changes the tone of the conversation. You’re not presenting a number with an asterisk about collection rates; you’re presenting the record.
Built for the questions you know are coming
Custom date ranges and exports exist because reviews, audits and site visits are the moments this data gets scrutinised. Whether a given report satisfies a specific review is a judgement for your institution and GME office — but the raw material is there, cut the way the question tends to get asked, without anyone assembling it by hand.
And the same reports serve the smaller moments: checking one resident’s month, handing leadership a quarter, or seeing whether a rotation redesign actually moved the hours.
A worked example
Say a program suspects one rotation is carrying more than its share. Run the WorkTime™ Summary for that program over the last two blocks and group it by WorkZone™ — every site lands side by side, with total shifts, total hours and average shift length against each.
If one site stands out, the WorkZone™ Daily Detail report takes it further: hours per resident, per day, at that single WorkZone™, one column per date. Now you’re not arguing about whether a rotation feels heavy; you’re looking at which days it’s heavy on.
Change the rotation, then run the same two reports a block later. That before-and-after — same cut, same source, no reassembly — is the part that’s hard to get any other way.